
Experimentation Analytics: How to Measure What Actually Changed

Updated: Apr 18

Table of Contents
Most teams do not struggle to come up with ideas. They struggle to understand whether those ideas actually worked in a meaningful way.
Inside most products, experimentation looks mature on the surface. There are dashboards, neatly defined A/B tests, clear variants, and statistically significant results. It creates the impression that the team is learning continuously and making data-driven decisions.
But that impression often collapses under a simple question. What actually changed in user behavior because of this experiment? The answer is rarely clear, and when it is unclear, decisions become fragile.
Experimentation does not fail because of a lack of creativity. It fails because measurement is treated as an afterthought rather than the core system.
TLDR
Most A/B tests measure outcomes but fail to explain behavior
Winning variants do not guarantee real product improvement
Weak metrics and small samples lead to misleading conclusions
False positives and short-term bias distort experiment results
True experimentation focuses on causality and behavioral change
Better measurement systems turn experiments into learning systems
What Is Experimentation Analytics?
Experimentation analytics is the process of measuring and interpreting the impact of experiments to understand what actually caused changes in user behavior.
What Is a False Positive in A/B Testing?
A false positive occurs when an experiment appears to produce a statistically significant result due to randomness rather than a real effect.
The Illusion of Learning in A/B Testing
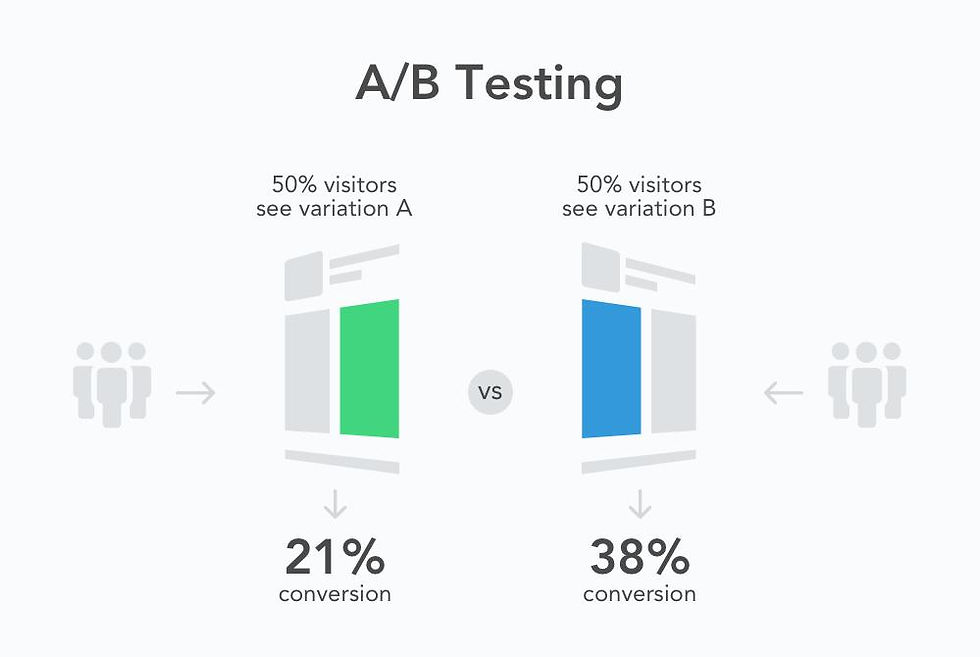
A/B testing gives teams a structured way to compare alternatives, but it also introduces a subtle trap. When one variant outperforms another, it feels like progress. The team records a win and moves forward. This limitation is widely discussed in experimentation literature, including work by Ron Kohavi.
The problem is that a “winning” variant only reflects a difference in observed metrics, not necessarily an improvement in the product. A change in conversion rate does not explain why users behaved differently. It does not reveal whether the experience became more valuable or simply more persuasive.
“A result without an explanation is not learning. It is just movement in numbers.”
Over time, teams accumulate results without accumulating understanding. This is how experimentation turns into a reporting exercise instead of a learning system.
Experimentation Is Not About Variants, It Is About Causality
At its core, experimentation is not about comparing versions. It is about isolating cause and effect in a complex system. Causal inference is a foundational concept in experimentation, as outlined in research by Judea Pearl.
User behavior is influenced by multiple factors at once. Seasonality, user intent, device differences, prior experience, and even randomness all play a role. Without careful design, it becomes difficult to attribute changes in metrics to the experiment itself.
This is why clean experimental design matters more than clever ideas. Randomization, control groups, and consistent exposure ensure that the observed difference is actually caused by the change being tested.
When causality is weak, interpretation becomes subjective. And once interpretation becomes subjective, experimentation loses its reliability.

Defining Success Metrics Is Where Most Experiments Break
The outcome of an experiment is largely determined before it even begins. It depends on how success is defined.
Teams often choose metrics that respond quickly. Click-through rate, session duration, and immediate conversions are easy to measure and easy to move. They create fast feedback loops, which makes experimentation feel efficient.
However, these metrics often act as proxies rather than representations of real value. Optimizing for them can lead to unintended consequences.
Metric Type | What It Captures | Risk |
Click-through rate | Immediate engagement | Encourages superficial interaction |
Session duration | Time spent | May reflect confusion, not value |
Conversion rate | Short-term action completion | Ignores long-term retention |
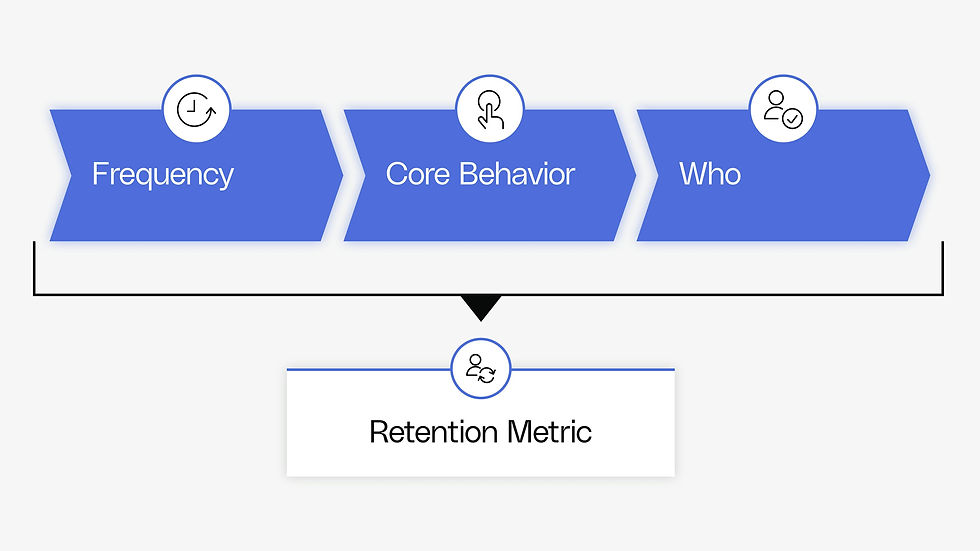
Retention | Sustained engagement over time | Slower to measure but more meaningful |
The challenge is not to eliminate proxy metrics but to connect them to outcomes that reflect actual user value. Without that connection, experiments optimize activity rather than impact.
When Metrics Lie: The Problem of False Positives
Not every positive result represents a real improvement. Some results appear significant purely due to randomness. The risk of false positives in repeated testing is well documented in statistical research and platform guidelines from Optimizely.
When multiple experiments are run or when metrics are observed repeatedly, the likelihood of false positives increases. Small fluctuations in data can be misinterpreted as meaningful signals.
This creates a dangerous pattern. Teams begin to trust results that are not stable, leading to decisions that do not hold over time.
A few common sources of false positives include:
Stopping experiments too early when results look promising
Testing multiple metrics without adjusting significance thresholds
Re-running experiments until a favorable outcome appears
The issue is not statistical complexity. It is overconfidence in results that have not been validated through sufficient data or replication.
Sample Size and Statistical Power
One of the most common weaknesses in experimentation is insufficient sample size. Experiments are often stopped as soon as results appear directional, especially under pressure to move quickly.
Small samples produce volatile outcomes. A small group of users can disproportionately influence the results, making the experiment appear more conclusive than it actually is.
Statistical power determines the ability of an experiment to detect real effects. Without enough data, even meaningful changes can go unnoticed, while random noise can appear significant. Statistical power and sample size considerations are core to reliable experimentation, as explained by Google.
Factor | Impact on Experiment Reliability |
Sample size | Larger samples reduce randomness |
Effect size | Smaller effects require more data |
Test duration | Longer duration captures variability |
User diversity | Broader samples improve generalization |
Balancing speed and reliability is one of the hardest parts of experimentation. Moving too fast increases the risk of wrong decisions, while moving too slowly reduces iteration velocity.
Short-Term Wins Versus Long-Term Impact
Many experiments are evaluated within a short time window. This creates a bias toward changes that produce immediate results. Short-term metric optimization challenges are frequently highlighted in case studies from Airbnb and Netflix.
A design change might increase conversions within a few days. A notification strategy might boost engagement within a week. These outcomes are easy to measure and easy to justify.
However, short-term improvements can mask long-term consequences. Increased notifications might lead to fatigue. Aggressive conversion tactics might reduce trust. Simplified flows might remove necessary context.
The distinction between short-term and long-term impact is critical. Measuring only immediate outcomes leads to decisions that optimize for quick gains while ignoring sustained value.
The Hidden Layer: Understanding Behavioral Change
Metrics provide outcomes, but they do not explain the mechanisms behind those outcomes.
To truly understand an experiment, it is necessary to analyze how user behavior changed.
This requires going beyond aggregate metrics and examining patterns such as:
How users move through key flows
Where they hesitate or drop off
Which segments respond differently
Whether behavior changes persist over time
This layer of analysis connects the experiment to user experience. It transforms results into insights.
Without this layer, experimentation remains shallow. It answers what changed, but not why it changed.

Segmentation and Heterogeneous Effects
Not all users respond to experiments in the same way. Aggregated metrics often hide important variations across segments. Heterogeneous treatment effects are a key concept in experimentation analysis, discussed in research by Susan Athey.
A feature might improve conversion for new users while negatively affecting experienced users. A pricing change might benefit one geography while harming another.
Segment-level analysis helps uncover these differences. It allows teams to understand where the experiment creates value and where it introduces risk.
Some common segmentation dimensions include:
New versus returning users
Device type or platform
Geographic regions
Behavioral cohorts
Understanding heterogeneous effects prevents overgeneralization and leads to more targeted improvements.
Why Most Experimentation Programs Plateau
In the early stages, experimentation produces visible gains. Small changes lead to measurable improvements, and teams gain confidence in the process.
Over time, however, the impact of experiments begins to diminish. Gains become incremental, and results become harder to interpret.
This plateau is not caused by a lack of ideas. It is caused by a limitation in measurement. Teams continue to optimize surface-level metrics without addressing deeper structural issues.
When experimentation is not connected to a broader measurement framework, it becomes a loop of local optimization. And local optimization has a natural ceiling.

From Results to Understanding: Building a Better Measurement System
Improving experimentation requires a shift in mindset. The goal is not to identify winners but to generate understanding.
This involves aligning metrics with user value, incorporating behavioral analysis, and evaluating both short-term and long-term outcomes. It also requires discipline in experimental design and interpretation.
A more effective approach to experimentation includes:
Defining primary metrics that reflect real outcomes
Supporting them with secondary metrics for context
Validating results across sufficient sample sizes
Analyzing behavioral changes alongside metric shifts
Monitoring long-term effects before finalizing decisions
This transforms experimentation from a decision tool into a learning system.
How to Run Experiments That Actually Produce Learning
Effective experimentation requires discipline in both design and analysis.
Follow this sequence:
Step 1: Define a clear causal hypothesis
State what you expect to change and why.
Step 2: Choose metrics that reflect real value
Prioritize retention, activation, or long-term engagement over proxy metrics.
Step 3: Ensure sufficient sample size
Run the experiment long enough to detect meaningful effects.
Step 4: Avoid early stopping
Do not conclude results based on short-term fluctuations.
Step 5: Analyze behavioral changes
Examine how user flows and actions changed, not just top-line metrics.
Step 6: Validate results over time
Confirm that results persist beyond the initial experiment window.
Methodology
This analysis is based on a combination of experimentation theory, product analytics practices, and observed patterns across digital products.
Instead of relying on a single dataset, it connects multiple layers:
Common experimentation frameworks used by product teams
Statistical principles such as causality, sample size, and significance
Behavioral analysis patterns observed in real user flows
The goal is to explain why experimentation often fails to produce learning and how measurement systems can be improved.
Conclusion: Measurement Determines What You Learn
It is easy to assume that better ideas will lead to better experiments. In practice, ideas are rarely the limiting factor.
Measurement is.
When measurement is shallow, experiments produce misleading conclusions. When measurement is rigorous, even small changes can reveal meaningful insights about user behavior.
The difference between teams that run experiments and teams that learn from them lies in how they measure what changed.
And in experimentation analytics, that difference defines everything.
FAQs
What is experimentation analytics in A/B testing?
Experimentation analytics is the process of measuring and interpreting the impact of experiments, such as A/B tests, to understand what actually changed in user behavior. It focuses on causality, not just metric movement.
Why do most A/B tests fail to produce meaningful insights?
Most A/B tests fail because they rely on weak metrics, small sample sizes, or misinterpreted results. Without proper measurement and analysis, experiments show changes in numbers but not real user impact.
What are false positives in experimentation analytics?
False positives occur when an experiment appears to show a significant result due to randomness rather than a real effect. This often happens when tests are stopped early or multiple metrics are tested without proper controls.
How do you choose the right success metrics for experiments?
The right success metrics should reflect real user value, such as retention or long-term engagement, rather than short-term proxy metrics like clicks or session duration.
Why is it important to measure long-term impact in A/B testing?
Measuring long-term impact ensures that short-term gains do not harm user experience or retention over time. It helps validate whether an experiment creates sustainable value.


Comments